Veodyn
Veodyn is an open-source, self-hostable data platform for transportation
agencies. A node is one complete instance, scoped to one agency: it pulls from
the systems that agency already runs, normalizes what arrives, stores it
locally, serves it over an API, and draws it. A node works standing alone on
infrastructure you control, and its source is
veodyn/veodyn-ce on GitHub, under the
AGPL.
Getting Started brings the whole stack up locally with one Docker Compose command.
Five surfaces
Every node ships all five of them.
| Surface | What it does |
|---|---|
| Adapters | Pull from transit, traffic, weather and fleet feeds (GTFS-RT, GBFS, TMDD, NTCIP 1203, and more), and from the SQL warehouses you already have |
| Normalization | Harmonize what arrives into typed columns against your own schema conventions |
| Warehouse | Local storage on infrastructure you control. The node is the system of record for your data |
| APIs | REST, per-query API keys, and a native Model Context Protocol endpoint for agents |
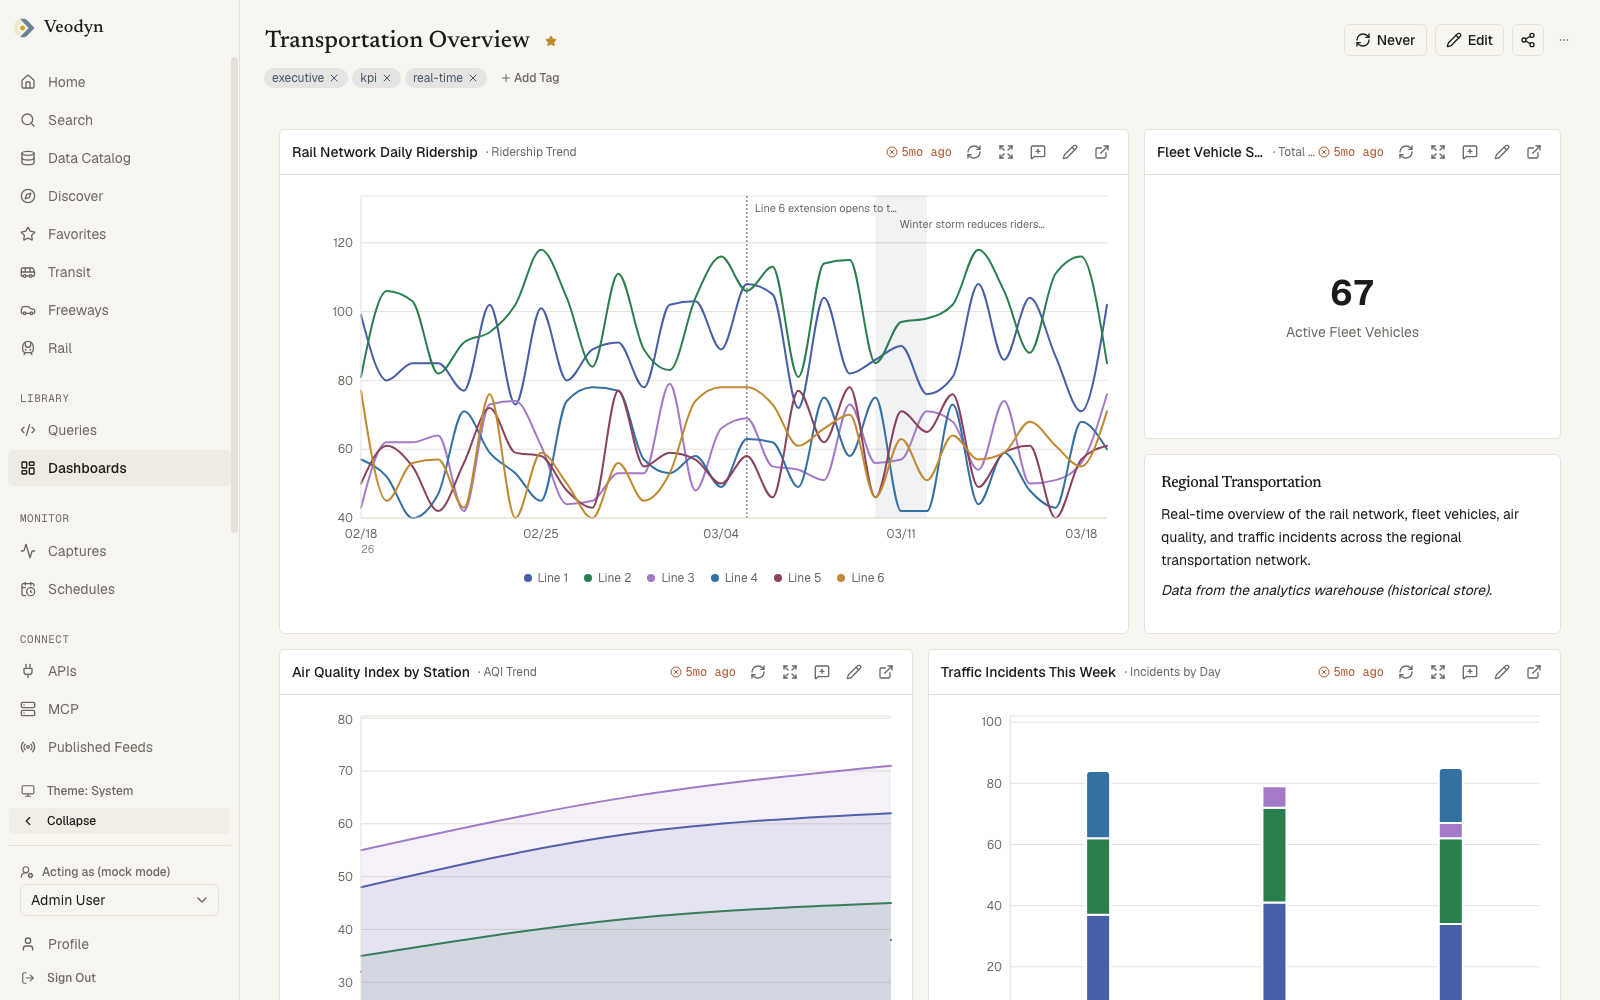
| Visualization | Dashboards, embeddable widgets, 15 core chart types, and an assistant that drafts them |
A hub runs the same five over its own data and adds federation across the nodes registered with it. That layer is commercial and is not part of this repository, so these docs describe a node throughout. Editions is where the boundary is drawn, and Architecture maps each surface onto the services that deliver it.
What you can do with it
- Queries: a full SQL editor with a schema browser, parameters, schedules, forking and per-query permissions, plus a no-code Visual builder that composes SQL from field picks.
- Dashboards: query results on a drag-and-drop grid, with auto-refresh, dashboard-level parameters, annotations and public share links.
- Visualizations: 15 core types, each with a live-preview editor. Instances can allowlist types and install custom visualization plugins.
- Data catalog: browsable datasets with schema, coverage and freshness, organized into domains your instance defines.
- Feed health: whether each upstream feed is current, judged against a cadence you declare, with the datasets it populates named beside it.
- Create with AI: a chat that drafts queries, dashboards and snippets, grounded in what your instance actually has, plus SQL generation in the editor.
- Search everything: one federated search over queries, dashboards and datasets, with a tag vocabulary shared across object types.
- White-label: brand name, logo, accent color, chart palette, fonts, domains and feature flags come from instance configuration rather than from code.
The enterprise edition adds the management layer on top: KPIs, governed reports, the alerts surface, wall and presentation modes, shared-link governance, enterprise SSO, and the AI digest.
How a node is built
A node is three services plus three datastores, behind one origin. Users only ever talk to the frontend, and every backend call goes through a server-side proxy route carrying the user's own session, so backend credentials never reach the browser.
| Layer | Technology |
|---|---|
| Frontend | Next.js 16, React 19, TypeScript, Tailwind CSS v4, shadcn/ui |
| Query service | Flask, SQLAlchemy, PostgreSQL, Redis |
| Sidecar API | Python 3.11, FastAPI, SQLAlchemy 2 |
| Historical warehouse | ClickHouse |
| AI | Anthropic Claude (bring your own key; every AI flow has a manual path) |
| Deployment | Docker images, Helm charts for Kubernetes |
Where to go next
- Getting Started: run a node locally.
- Editions: node or hub, Community or Enterprise, and what each one includes.
- Configuration: brand it as your own instance.
- Architecture: how the five surfaces map onto the services.
- Deployment: production installation on Kubernetes.