Data Catalog & Domains
The catalog answers "what data does this instance actually have": browsable datasets with schema, row counts, coverage, and the feeds that populate them. It lives at Data Catalog in the sidebar.
What a domain is
A domain is your instance's top-level subject grouping: Transit, Freeways, Rail, or whatever the operator configures. Domains organize more than the catalog: each one gets its own sidebar entry and domain page, queries and dashboards join a domain by carrying a domain:<key> tag, and on an enterprise build KPIs and reports carry a domain of their own so they can be found by subject in search and lists. The set of domains is fixed per instance by configuration; users pick from it rather than inventing their own.
Browsing
Dataset pages
/data/dataset/<id> is everything known about one table. The id is the warehouse table name itself, which is why dataset URLs read like q_riits_demo_bikeshare_stations_32 rather than a number.
The header carries the dataset's name, a description saying where it comes from and how much has accumulated, and a Query this dataset button that opens its sample query, or a blank editor if it has none.
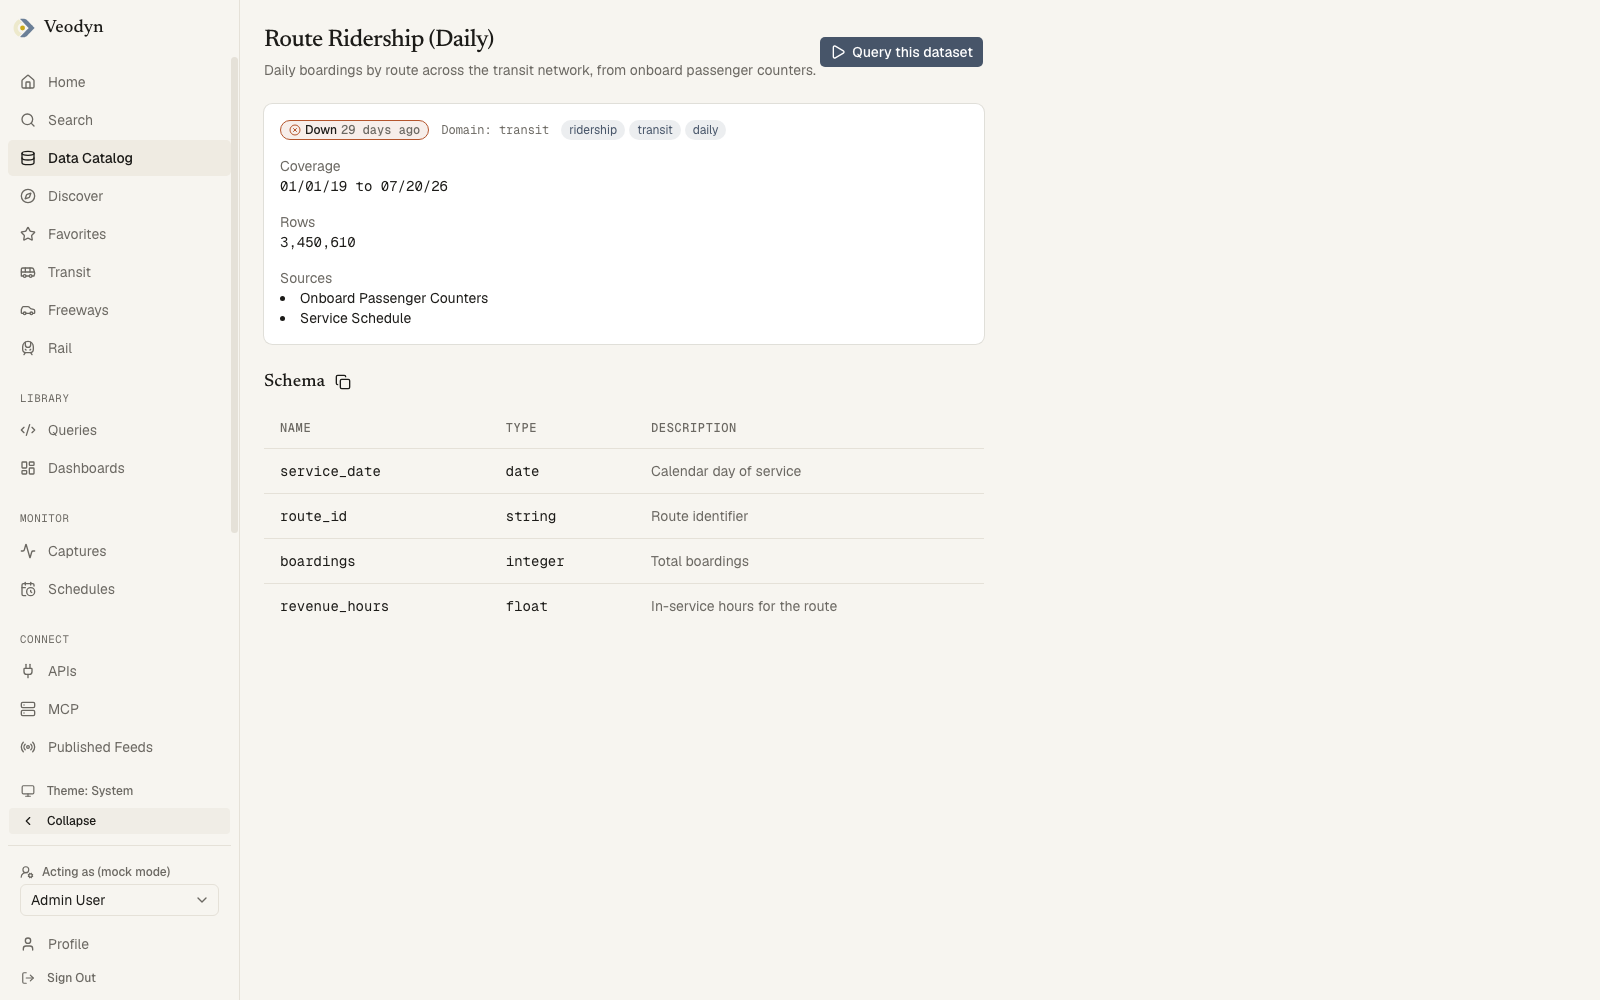
Below that, one card of metadata:
| Field | Meaning |
|---|---|
| Freshness badge | The same Fresh / Stale / Down verdict used everywhere else, on a captured dataset |
| Domain | A link to that domain page, when the dataset belongs to one |
| Tags | Editable in place by any signed-in member, with autocomplete over the existing vocabulary |
| Coverage | The first and last timestamp the dataset holds, in your chosen date format |
| Rows | How many rows in total |
| Sources | The feeds or queries that write into it |
Then the Schema: every column with its type and, where one is recorded, a description. Types are the warehouse's own, so Nullable(Float64) and DateTime64(3, 'UTC') appear as written rather than translated. A copy button beside the heading puts the whole schema on the clipboard as JSON, which is the form a script or an AI client wants it in.
Tags here are wiki-like. A dataset has no owner to check against, since its id is a warehouse table rather than something a person created, so curating them is open to any member of the org.
An id that matches no dataset says Dataset not found, and a catalog service that cannot be reached says so instead of showing an empty table.
Where a dataset comes from
Every dataset states its origin, and whether this build can write to it. Those two answers change what its page renders.
| Origin | What it is | Freshness badge | Schema table | Records |
|---|---|---|---|---|
| Capture | A table the warehouse accumulated from a scheduled query | ● | ● | |
| Contributed | A dataset a registered provider serves, which nothing captures | ● |
A contributed dataset carries no freshness badge. Stale describes a feed that stopped arriving, and a dataset nobody feeds has not stopped; it is finished when its author says so. An empty one shows why: it has no coverage end, so it would read as stale on the day it was declared.
It shows no schema table either. Its columns are the ones declared for it, and the record table below already renders every one of them under its own name. Repeating them would also add two columns that are not part of the declaration, since captured_at and source belong to the log the view is built from. On a capture, that table is the only place the shape is written down, so there it stays.
A contributed dataset gets the full page width, because it is a page you type into. A narrow column keeps a description readable, but it is also what makes a sixteen-column record table scroll sideways inside itself.
A community build renders no record editor, so a contributed dataset there is a catalog entry with nothing to type into. The editor, and the actions beside the dataset's name, come from the enterprise pack. Managed Datasets covers declaring one and typing into it.
Domain pages
/data/<domain> is a single subject's landing page: the datasets that belong to it, the dashboards linked to it, and, on an enterprise build, the numbers that describe it. It opens with the domain's name and icon.
Counters run across the top on an enterprise build. A counter tied to a KPI renders that KPI's live scorecard, with its value, target, change and status word, and the age of the data underneath it on a second line. The second line is the one worth checking, because the scorecard's own timestamp is when the metric was last computed, which on a dead feed keeps ticking over quite happily, while the line below it is how old the data is. A counter with no KPI behind it shows as a plain number.
A community build draws no counter row at all, neither a row of zeroes nor an empty placeholder. Counters come from providers that an installed feature registers, and with none registered the page receives an empty list and renders nothing. A row of zeroes would say the concept exists here and has no members, when in fact it does not exist here.
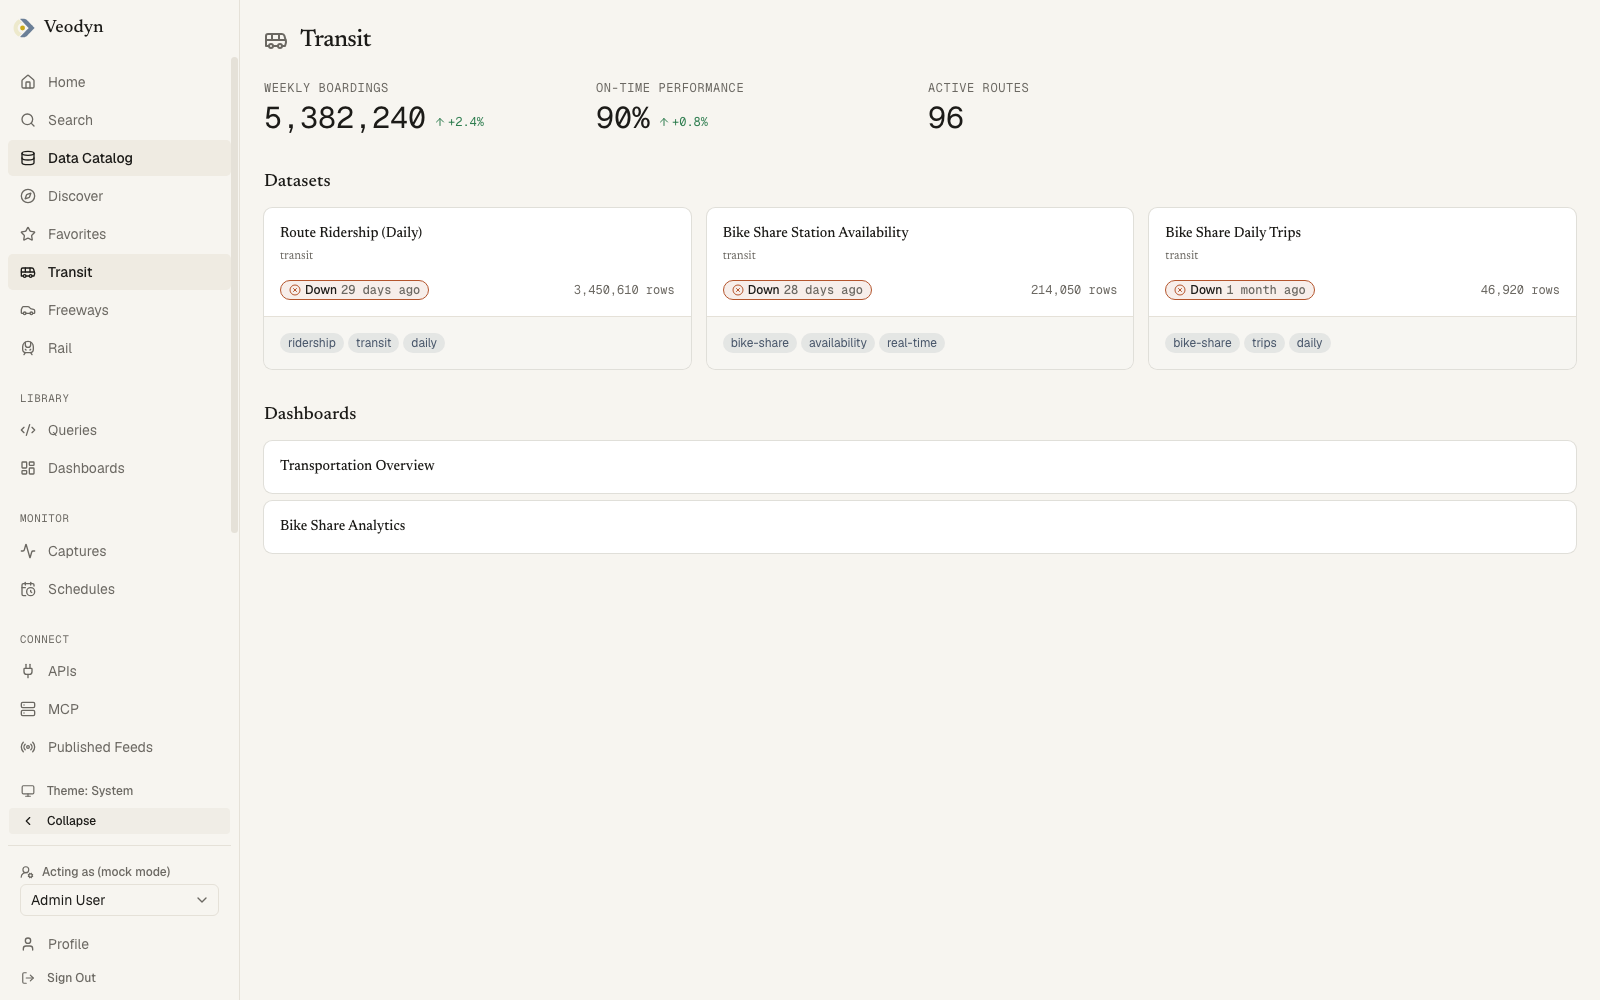
Datasets lists the domain's datasets as the same cards used in the dataset list. Dashboards lists everything linked to the domain. Either section says so plainly when it is empty.
A linked dashboard always gets a row even when its name has not been read yet, appearing as Dashboard 12 rather than vanishing, so a name that has not loaded yet does not cost you the link.
A domain page appears in the sidebar, and opens at all, only when the domain is configured for the instance. A key the config does not declare says Domain not found, whether or not anything is filed under it.
How a domain gets its members
Two different things decide whether a domain page exists and whether it has anything on it, and they are configured in different places. This is the single most common reason a domain page is reachable but empty.
| Where it comes from | Who changes it | |
|---|---|---|
| The domain exists | The domains list in veodyn.config.yaml | An operator, by editing config and restarting |
| Datasets and dashboards belong to it | A domain:<key> tag on the query or dashboard in the query backend | An analyst, by tagging in the UI |
Declaring a key does not populate it. A configured domain with nothing tagged is a real page whose two sections both say they are empty, which is the honest answer rather than an error.
Membership is worked out live, with no second registry to keep in step:
- Dashboards are the dashboards tagged
domain:<key>. - Datasets are the captured tables belonging to the queries tagged
domain:<key>, which is two conditions rather than one: a tagged query that has never captured a table is not a dataset and does not appear. Tag a dashboard and it shows up immediately; tag a query and it shows up once that query has captured.
Because membership is read through the viewer's own session, two people opening the same domain page can see different members, and neither is seeing a bug. A hub never names a query or dashboard its reader could not open anyway.
On an enterprise build, GET /api/domains discovers keys from two sources: the domain: tags in use, and the domain recorded on each KPI. A KPI carrying a domain therefore puts that key in the API response even when nothing is tagged with it, so the key list is not evidence that any dataset or dashboard is filed under it. Read the hub's own sections for that.
The dataset list
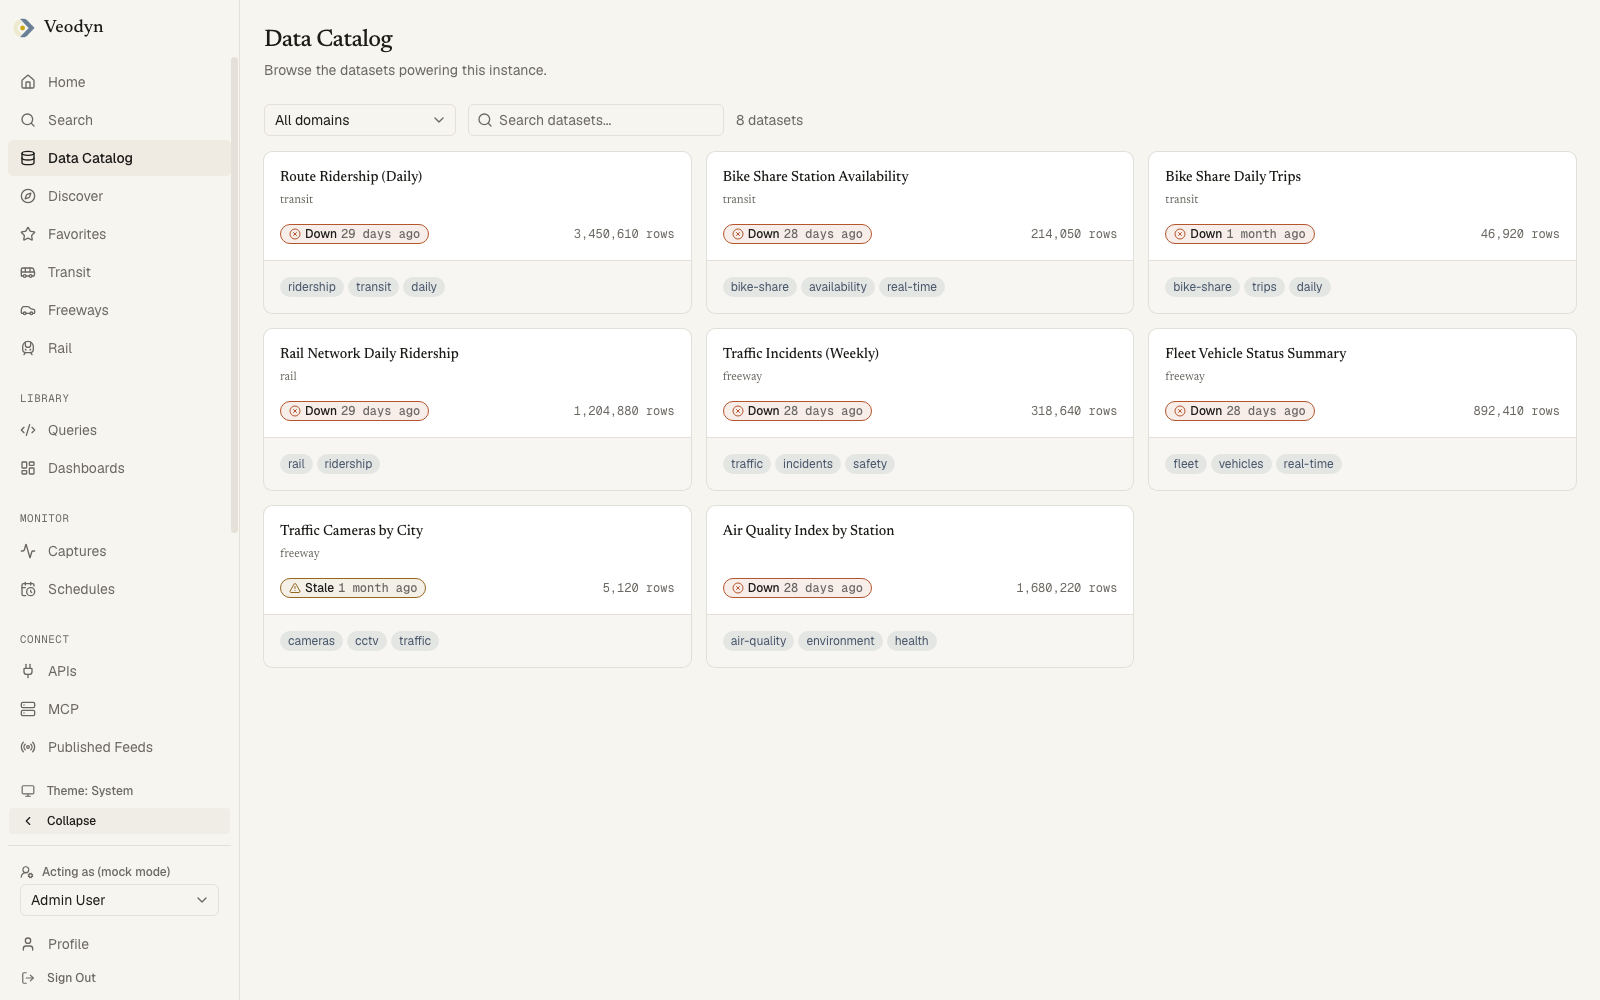
/data is every dataset in the instance as a grid of cards, with a count beside the search box.
Each card carries the dataset's name, which is the link to its page, the domain it belongs to if it has one, its row count, and its tags. Where the badge goes depends on where the dataset came from: a captured one shows its freshness badge, and a contributed one is marked Managed instead, so a dataset you can type into is distinguishable from the captures either side of it in the grid. Tag chips are links in their own right, so a chip searches for everything carrying that tag rather than opening the dataset under it. Tags of the form domain:* are structural and never shown as chips.
Reading the freshness badge
Three states, and they are the same three the Captures board reports, resolved by the same rule so the two pages cannot disagree:
| Badge | Means |
|---|---|
| Fresh | The dataset has been updated within the cadence its capture is expected to keep |
| Stale | It has not, and is overdue |
| Down | The capture behind it is not running |
The badge appears on captured datasets only, for the reason given above.
The verdict is a function of elapsed time, so it ages while the page is open: a badge reading Fresh when you arrived will turn Stale on its own if the next update does not arrive. The time beside the badge is when the dataset last received data, not when the page loaded.
Filtering
The search box matches a dataset's name, description and tags, case-insensitively, so typing a tag name finds the datasets carrying it.
A domain filter sits beside the search box on instances that have configured domains, defaulting to All domains. An instance with none configured has no filter, because there would be nothing to choose between.
When the catalog is empty or unavailable
| What happened | What you see |
|---|---|
| Loading | Placeholder cards |
| The catalog service is unreachable | Unable to load the catalog. The catalog service may be unavailable. |
| Your filters match nothing | No datasets match those filters. |
| The instance has no datasets | No datasets yet. They appear here once a data source has been queried. |
Those last two say different things on purpose. A filter you can widen is a different situation from an instance with nothing in it, and telling them apart saves you looking for data that was never there.
Datasets, queries and dashboards share one tagging system, joined by KPIs and reports on an enterprise build, so a tag search crosses object types.
Where the catalog comes from
The catalog is served by the veodyn-api sidecar over the historical warehouse (ClickHouse), and it is assembled from every registered dataset source instead of from one place.
The warehouse's own registry is one such source, and on a community build it is the only one. An admin opts a data source into historical capture (any source type, with manual runs an extra opt-in beside the schedule), every captured run of its queries lands as rows in the warehouse, and the query service records each capture table there. An enterprise pack registers further sources, which is how a dataset the warehouse never captured can appear in the catalog at all.
Whatever a source leaves unsaid, the catalog fills in from ClickHouse's own system tables: the schema, the row count, the coverage span. Nothing is invented beyond that. A dataset with no rows reports no coverage instead of a plausible-looking range, and a source that says nothing about where its rows came from gets an empty description instead of a borrowed sentence about a Redash capture that never happened.
Two mechanics matter once a deployment runs more than one source:
- A source can take the place of one it replaced. A pack that renames a captured table and puts a view under the original name would otherwise leave the same dataset in the catalog twice under two ids, with every consumer keying on whichever arrived first. The replacing source names what it shadows, and the shadowed entry drops out, including as a target for tags.
- A source states its own row count where the warehouse cannot. A view stores no rows, so asking the warehouse would report every contributed dataset as empty.
When it is empty rather than broken
A fresh install has no historical database and no capture registry, because the query service creates them the first time it captures a result. That is an empty catalog rather than a failure, and the catalog, the domain pages and Captures all report having nothing instead of answering 502, whichever of the two is missing.
One registered table shaped differently from the rest does not fail the catalog for all of them either. It is left out, and the others are served.
On an instance without the sidecar or without ClickHouse configured, the catalog pages state that the service is unavailable and fall back to demo fixtures.