Build an agency performance scorecard
A dashboard shows numbers. A scorecard adds the judgment: what each number should be, which direction is good, at what point somebody has to act, and who that somebody is. In the product that judgment is a KPI: a named metric with a target, thresholds, an owner and a cadence, evaluated on schedule, with its history kept and an alert armable on its breach.
KPIs, alerts, and the presentation and wall modes in step 6 are all part of the enterprise edition.
What has to be true
Each measure needs a saved query that returns the number in a column. The guides that produce the usual candidates come first: on-time performance, the ridership pack, demand-response measures.
The targets and thresholds have to be decided by someone. The product records a target; it has no opinion about what yours should be, and a scorecard whose bands were made up to fill the form will be ignored the first time it turns red.
Every KPI carries an owner, and the scorecard works to the degree that name is a person who acts on a breach rather than a department label.
The steps
1. Define a KPI per measure
Library → KPIs → New KPI is one form in three sections: details (name, owner, domain, unit, cadence of Hourly, Daily or Weekly), the source, and the target with its status bands.
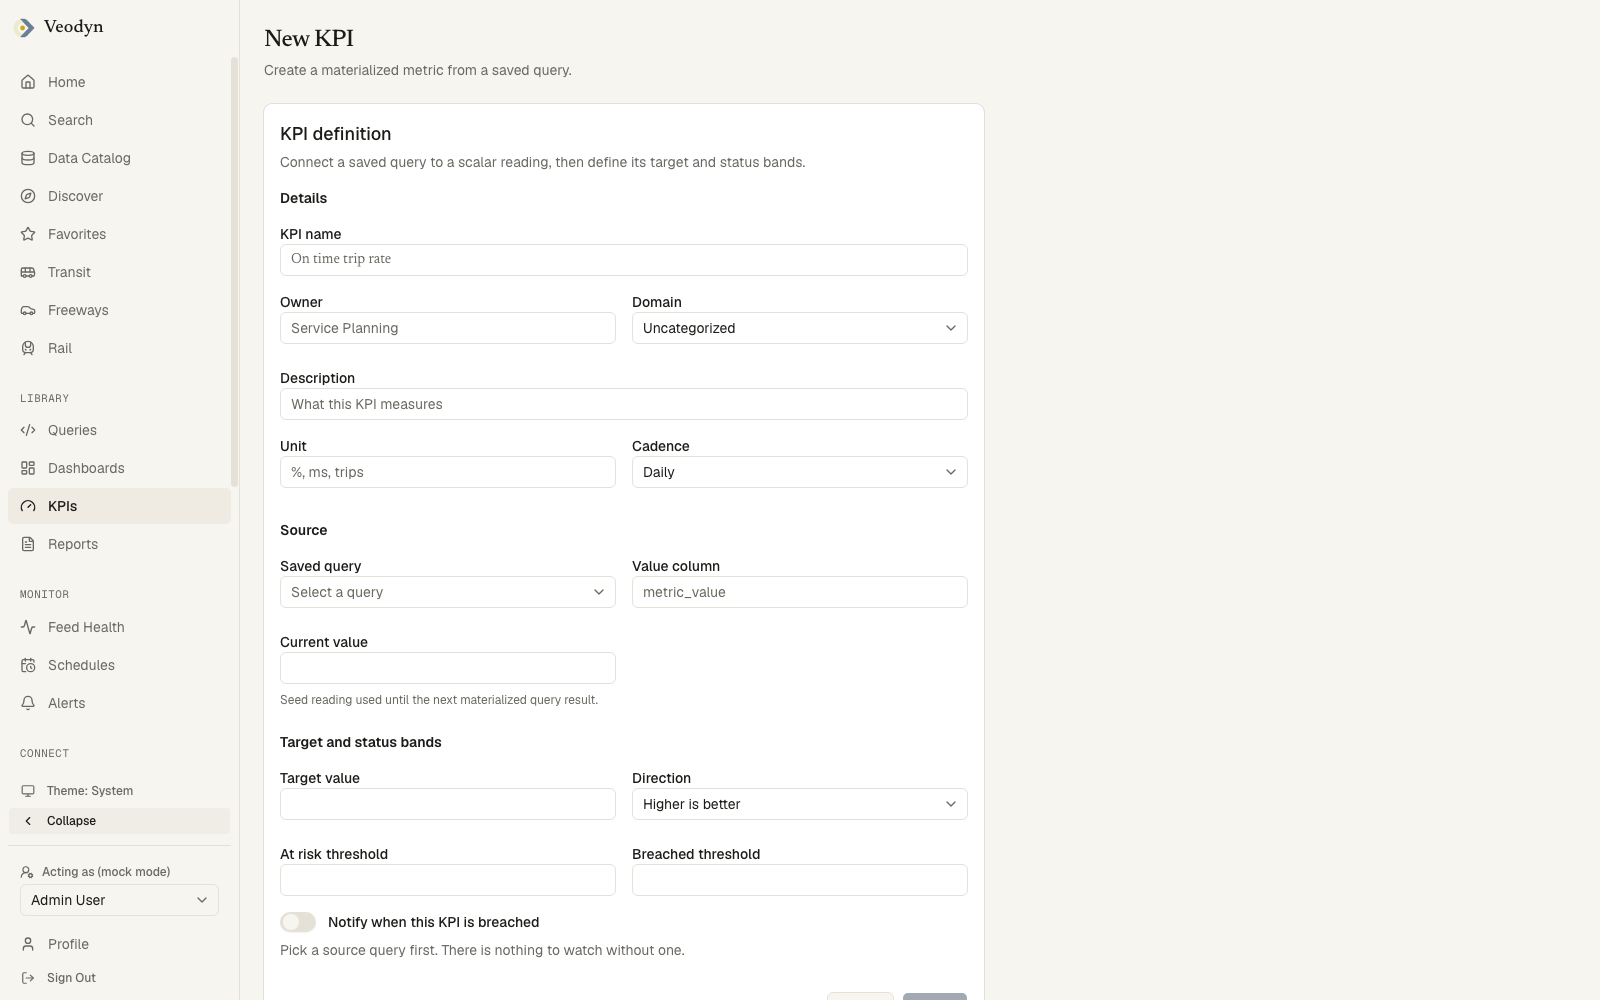
Two things the form enforces so the scorecard stays honest. You do not type the current value: the number is whatever the source query returns on the next scheduled evaluation, usually within a minute. And the thresholds have to be in order for the chosen direction: for higher-is-better, at risk sits above breached, and the form refuses the reverse.
2. Watch the pipeline beside the service
A KPI can also measure a capture or a published feed directly, from a fixed list of measures such as delivery ratio, seconds since last row, or publish success rate, each with its unit and direction filled in. Put one or two of these on the scorecard. Service metrics say how the agency performed; these say whether the data underneath them is arriving at all, so a good-looking number on a dead feed does not go unquestioned.
3. Arm the breach alerts
The Notify when this KPI is breached toggle arms a real alert whose condition follows the KPI's breached threshold; recipients are added on the alert once it exists. When arming could not work, the toggle disables itself and says why: an archived query can never fire, and a parameterized query cannot be alerted on because no parameter values reach the scheduled run.
4. Read it the way it is meant to be read
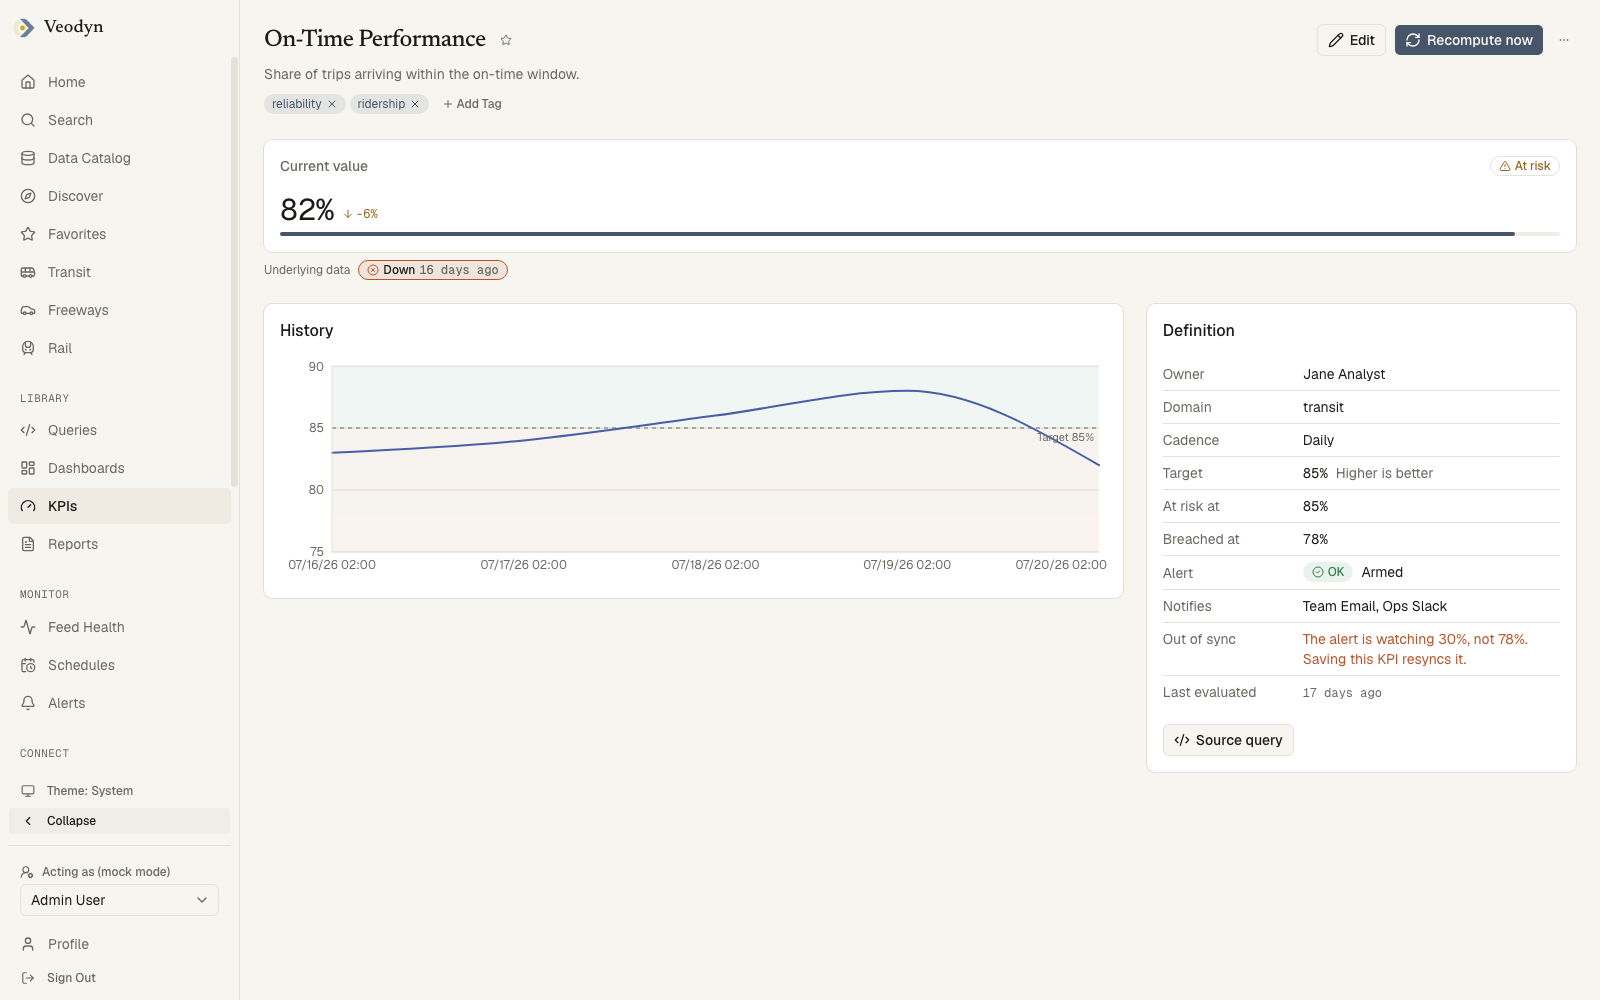
The list's Status and Data columns answer different questions: whether the number is good, and whether there is a number at all. A KPI on a frozen feed keeps evaluating punctually and keeps reporting On track off the last value it managed to read, so On track beside a stale Data badge is the combination to stop at. The KPI's own page adds the history chart with the target and both bands drawn behind it, so a value drifting toward a threshold is visible before it crosses.
5. Put it on a dashboard
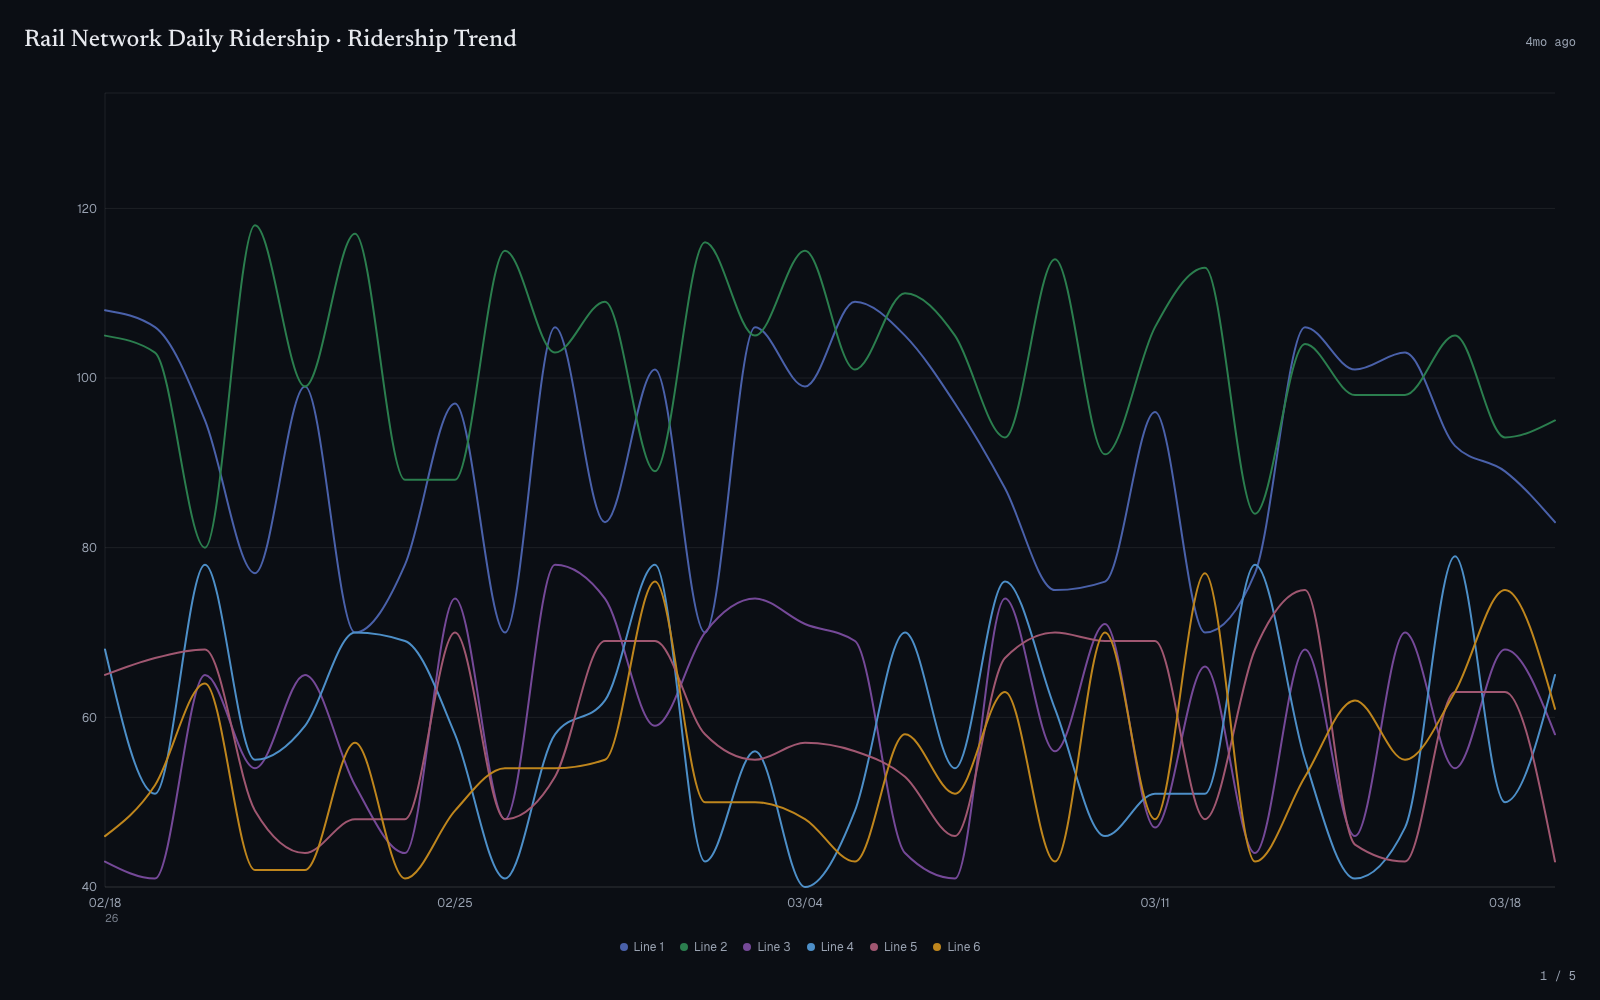
Each KPI gets a KPI history visualization (its value over time with the bands), placeable as a dashboard widget beside counters for the current values. Set the dashboard's refresh rate and the board stays current while it is open.
6. Present it
Present turns the dashboard into a full-screen deck, one widget per slide, driven by the keyboard. The deck plays widgets in the order the server returns them, not the order of your layout, so step through it once before standing in front of anyone.
For the operations room, wall mode serves
one operator-chosen dashboard (wall_mode.default_dashboard) as an
unattended, chrome-free display. When the backend becomes unreachable, the
wall keeps the last known values with a banner saying so, rather than going
blank.
How you know it worked
Recompute now on each KPI forces an evaluation and reports either way, so you do not wait a week to learn a weekly KPI is misconfigured. The Definition card should read Armed with a real recipient beside Notifies. Then trip one alert on purpose: set a breach threshold the current value violates, wait one evaluation, and confirm the notification arrives where you claimed it would. Restore the real threshold afterwards. A breach path that has never fired is a hope, not an alert.
What takes it off the air
| What happened | What you see |
|---|---|
| The source query or value column was changed | The KPI's stored readings are discarded, and the form warns first, naming how many go; the history restarts |
| The feed under a KPI died | Status keeps reporting On track; only the Data column and the Captures board's Metrics affected show the rot |
| The watched query was archived or parameterized | The alert toggle refuses with the reason, before the save |
| Evaluations keep failing | The worker backs off after repeated failures, so the history gets sparse rather than the service hammering a broken query |
| Wall mode was never configured | The wall says so and names wall_mode.default_dashboard, rather than showing an empty screen |